Mastering Observability: Empowering Developers from Zero to Hero with Spring & the Grafana stack

1 The sad reality
Picture this: it’s Friday afternoon, and you’re eagerly looking forward to unwinding for the weekend. Suddenly, an Ops engineer alerts you about a critical issue—a stubborn HTTP 500 error that’s causing a major roadblock.
Despite the dedicated efforts of the Ops engineers, the root cause remains elusive due to a lack of contextual information.
Hours pass by, but you take it upon yourself to delve into the problem. Eventually, after reproducing and debugging the issue on your computer, you uncover the issue.
Does this sound like science fiction? If you’ve experienced a similar scenario, you’re likely familiar with the challenges posed by unidentified end users and their unique usage patterns—enter Ops and observability!
I’ve previously delved into the topic of observability. Here are a bunch of articles I wrote on this blog or on the Worldline Tech Blog:
- Enhancing Asynchronous Transaction Monitoring: Implementing Distributed Tracing in Apache Camel Applications with OpenTelemetry
- Observabilité et Circuit Breaker avec Spring
- Enabling distributed tracing on your microservices Spring app using Jaeger and OpenTracing
In this article, I aim to highlight the importance of putting in place observability during the earliest stages of a project. I will then outline how to merge logs and traces from a good old Spring Boot application on the Grafana Stack to gain clearer insights into your platform’s workings. By doing so, you can transform your relationship with Ops teams, making them your best friends.
2 A definition of Observability
We can shortly define it as this:
Observability is the ability to understand the internal state of a complex system. When a system is observable, a user can identify the root cause of a performance problem by examining the data it produces, without additional testing or coding.
This is one of the ways in which quality of service issues can be addressed.
3 A short presentation of the Grafana stack
The Grafana stack aims at a tool which allows you to query, visualise, alert and explore all of your metrics. You can aggregate them through a wide range of data sources. With regard to the topic of this article,it will provide us all you need to collect logs, metrics and traces (and beyond) to monitor and understand the behaviour of your platforms.
I will therefore particularly focus on:
By the way, I also configured in this project a Prometheus TSDB to store metrics.
To get it started easily, I just created a Docker Compose stack to run it on your desktop.
You can run it with these commands:
cd docker
docker compose up
4 Logs, Traces & Monitoring
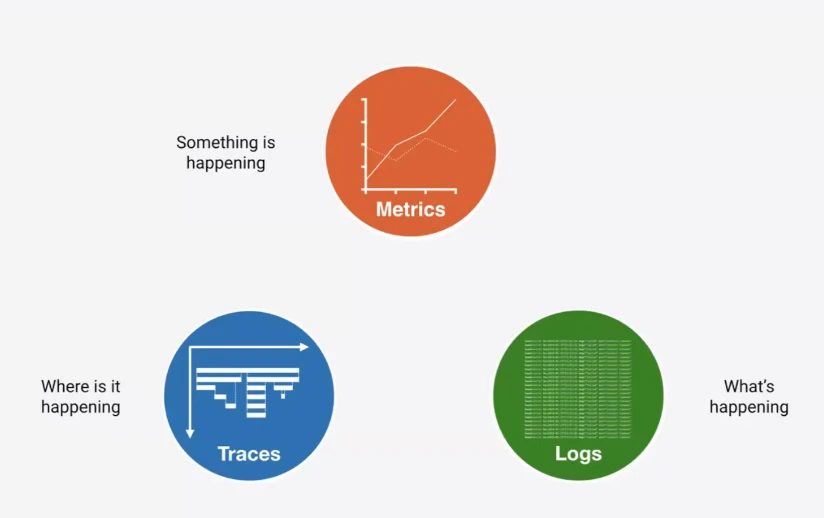
Let’s go back to the basics: To make a system fully observable, the following abilities must be implemented:
- Logs
- Traces
- Metrics
They can be defined as follows:
5 Logs
When a program fails, OPS usually tries to identify the underlying error analyzing log files. It could be either reading the application log files or using a log aggregator such as Elastic Kibana or Splunk.
In my opinion, most of the time developers don’t really care about this matter. It is mainly due to they did not experience such a trouble.
For two years, I had to administrate a proprietary customer relationship management solution. The only way to analyse errors was navigating through the logs, using the most appropriate error levels to get the root cause. We didn’t have access to the source code (Long live to open source programs). Hopefully the log management system was really efficient. It helped us get into this product and administrate it efficiently.
Furthermore, I strongly think we should systematise such experiences for developers. It could help them (us) know what is behind the curtain and make more observable and better programs.
5.1 Key principles
You must first dissociate the logs you make while you code (e.g., for debugging) from the production logs. The first should normally remove the first. For the latter, you should apply some of these principles:
- Identify and use the most appropriate level (
DEBUG,INFO,WARN,ERROR,…) - Provide a clear and useful message for OPS (yes you make this log for him/her)
- Provide business context (e.g., the creation of the contract
123456failed) - Logs must be read by an external tool (e.g., using a log aggregator)
- Logs must not expose sensitive data: You must think about GDPR, PCI DSS standards
If you want to dig into log levels and the importance to indicate contextual information into your logs, I suggest you reading this article from my colleague Nicolas Carlier.
6 What about Grafana Loki
For this test, I chose to use loki-logback-appender to send the logs to Loki.
The configuration for a Spring Boot application is pretty straightforward:
You must add first the appender to your classpath:
implementation 'com.github.loki4j:loki-logback-appender:1.4.2'and create a logback-spring.xml to configure it:
 <appender name="LOKI" class="com.github.loki4j.logback.Loki4jAppender">
        <http>
            <url>http://localhost:3100/loki/api/v1/push</url>
        </http>
        <format>
            <label>
                <pattern>app=${name},host=${HOSTNAME},level=%level</pattern>
                <readMarkers>true</readMarkers>
            </label>
            <message>
                <pattern>
                    {"level":"%level","class":"%logger{36}","thread":"%thread","message": "%message","requestId": "%X{X-Request-ID}"}
                </pattern>
            </message>
        </format>
    </appender>
Et voilà!
After restarting your application:
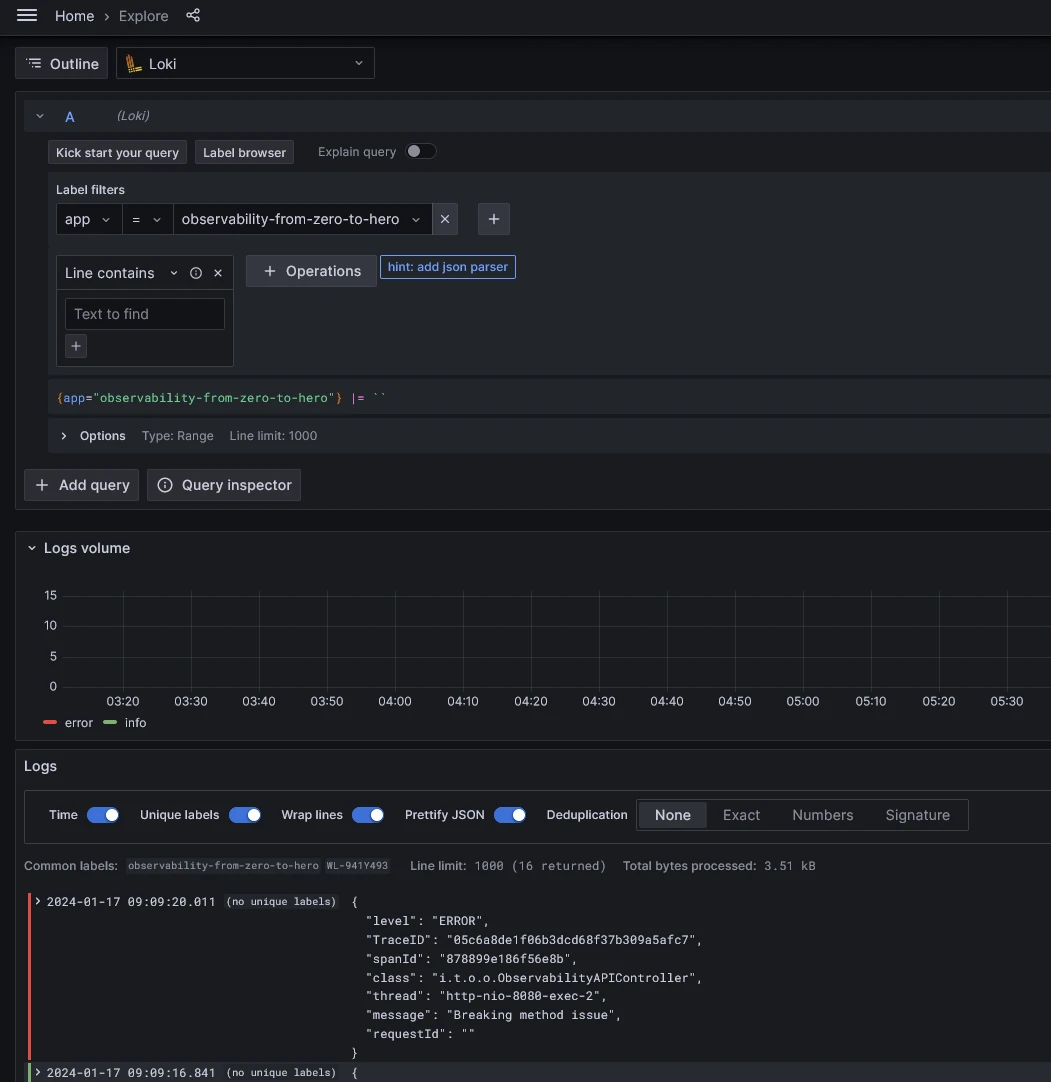
gradle bootRunAfter running some API calls with the following command:
http :8080/api/eventsYou can now get logs browsing Grafana
7 Traces
Upon initial inspection, one might consider the existing setup sufficient. However, I highly recommend delving into the realm of Distributed Tracing, a technology I have previously introduced (refer to the aforementioned discussion). Not only it will be first really useful when you deploy distributed architectures but also for the other kind of platforms.
The true value of distributed tracing becomes evident not only in the deployment of distributed architectures but across various platforms. In the complex landscape of production issues, identifying the root cause or understanding why a specific SQL query failed or took an extended duration can be challenging. Traditionally, attempts to replicate such issues in alternative environments often fall short due to the inherent complexities of data, server configurations, and benchmarking.
This technology empowers you to gain valuable insights that were previously elusive. When grappling with production issues, you no longer need to rely solely on replication efforts; distributed tracing provides a clear and comprehensive perspective on what might be amiss.
To sum up: Try it, you’ll like it!
7.1 The setup
There is several ways to set it up. Nowadays, OpenTelemetry is the de facto standard. Most of the solutions are compatible with it.
Nevertheless, after challenging some APMs, I found some missing features which are really useful in real life projects. For instance, you can not easily ignore URLs, for instance the actuator endpoints, from the traces you will manage. You can do that in just one property with the Elastic APM agent. There is an issue about this feature.
I suggest using the agents. It is less intrusive than other solutions.
For instance if you use the spring boot gradle plugin you can configure it as following:
plugins {
    id 'java'
    id 'org.springframework.boot' version '3.2.1'
    id 'io.spring.dependency-management' version '1.1.4'

}

ext {
    opentelemetryAgentVersion = '1.32.0' // Mettez la version appropriée
}

group = 'info.touret.observability'
version = '0.0.1-SNAPSHOT'

java {
    sourceCompatibility = '21'
}

repositories {
    mavenCentral()
}

dependencies {
    implementation 'org.springframework.boot:spring-boot-starter-actuator'
    implementation 'org.springframework.boot:spring-boot-starter-web'
    implementation 'io.micrometer:micrometer-registry-prometheus'
    testImplementation 'org.springframework.boot:spring-boot-starter-test'
    implementation 'com.github.loki4j:loki-logback-appender:1.4.2'
    implementation "io.opentelemetry.javaagent:opentelemetry-javaagent:${opentelemetryAgentVersion}"

}

task copyJavaAgent(type: Copy) {
    from configurations.detachedConfiguration(
            dependencies.create("io.opentelemetry.javaagent:opentelemetry-javaagent:${opentelemetryAgentVersion}")
    )
    into "${project.getLayout().getBuildDirectory()}/javaagents"
    rename { 'javaagent.jar' }
}

processResources.dependsOn copyJavaAgent

bootRun {
    doFirst {
        jvmArgs = ["-javaagent:${project.getLayout().getBuildDirectory()}/javaagents/javaagent.jar"]
    }

    //
    // systemProperties = [
    //     'otel.traces.sampler': 'parentbased_traceidratio',
    //     'otel.traces.sampler.arg': '0.2'
    // ]
}
tasks.named('test') {
    useJUnitPlatform()
}
After restarting your application, you can reach the API with this command:
http :8080/api/eventsThis API is really simple. To illustrate how to handle errors using both the Spring stack and the Grafana stack, an error is always thrown using the Problem Detail RFC 7807 while reaching it.
Here the service:
@Service
public class ObservabilityService {
    public void breakMethod() {
        throw new IllegalStateException("Breaking method issue");
    }
}
And the controller which returns the error:
@GetMapping("/api/event")
public ResponseEntity<ObservabilityEventDto> getEvent() throws ErrorResponseException {
        try {
            observabilityService.breakMethod();
            var observabilityEventDto = new ObservabilityEventDto(UUID.randomUUID().toString(), "OK");
            return ResponseEntity.ok(observabilityEventDto);
        } catch (Exception e) {
            var observabilityEventDto = new ObservabilityEventDto(UUID.randomUUID().toString(), "Error");
            LOGGER.error(e.getMessage());
            throw new ErrorResponseException(HttpStatus.INTERNAL_SERVER_ERROR, ProblemDetail.forStatus(HttpStatus.INTERNAL_SERVER_ERROR), e);
        }
    }
Using Problem Detail responses, you will get such a response when an error occurs:
http :8080/api/events
HTTP/1.1 500
Connection: close
Content-Type: application/problem+json
Date: Wed, 17 Jan 2024 08:09:20 GMT
Transfer-Encoding: chunked
{
"instance": "/api/events",
"status": 500,
"title": "Internal Server Error",
"type": "about:blank"
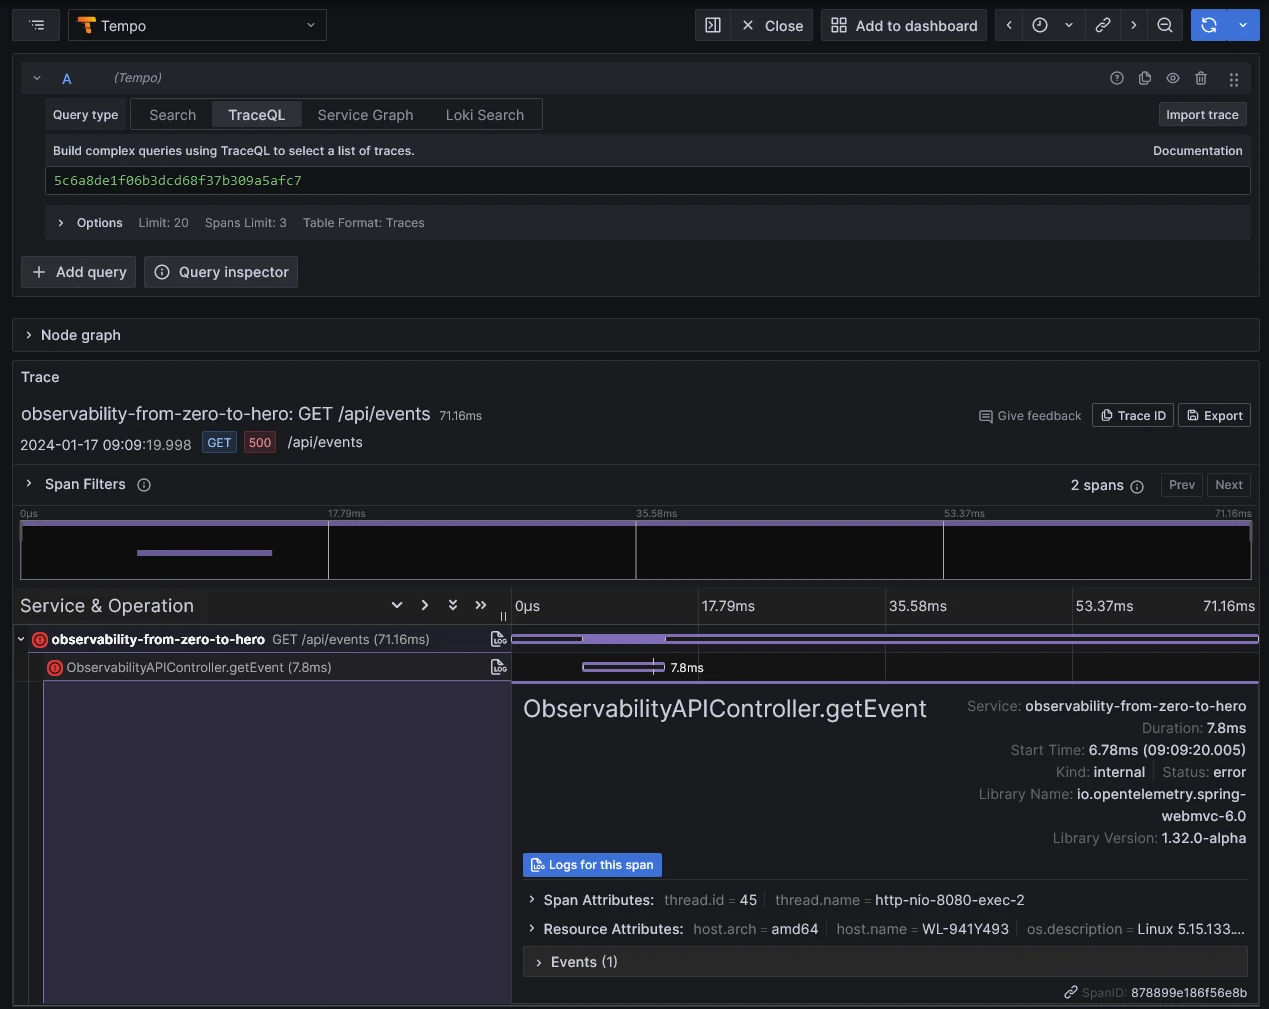
}After testing this service a few times, you can now see the traces on your Grafana dashboard.
7.2 Head or Tail sampling?
One significant drawback of implementing this technology lies in the potential performance overhead it introduces to the instrumented application. In cases where high-pressure APIs generate or broadcast SPANs for every transaction, there’s a substantial risk of significantly impacting the Service Level Objectives (SLOs) of your platform.
A viable solution to mitigate this challenge involves sampling the traces, such as retaining only 20% of the transactions. There are two primary approaches:
Head Sampling: In this method, SPANs are sampled and filtered directly from the producer (e.g., a backend). This is essential for heavily utilized platforms and proves to be the most efficient, as it produces only the necessary spans, thereby avoiding the dissemination of unnecessary SPANs. However, it comes with the trade-off of potentially losing critical traces involving failures. The sampling rate is purely statistical (e.g., 10 or 20% of SPANs sampled and broadcast).
Tail Sampling: Alternatively, SPANs are sampled retrospectively, often through tools like the Open Telemetry Collector. While this method allows for filtering SPANs based on various criteria, such as the transaction status, it does not address the overhead issue. All SPANs are initially broadcast and then filtered, making it less suitable for heavily used scenarios.
Both approaches have their pros and cons, and the choice depends on the specific requirements of the platform. For an in-depth exploration of this issue, you can refer to this article.
8 Correlating Logs & Traces
Now, you have on one side the logs of your applications, and on the other the traces. To dig into errors and see what is behind the curtain of any error logged, it is really import to correlate both.
For that, you must specify in your logs the traceID and spanID of the corresponding trace.
Hopefully, logback and the Loki appender can help you on this!
We therefore will modify the pattern of the logs in the logback-spring.xml file:
<pattern>
    {"level":"%level","TraceID":"%mdc{trace_id:-none}","spanId":"%mdc{span_id:-none}","class":"%logger{36}","thread":"%thread","message": "%message","requestId": "%X{X-Request-ID}"}
</pattern>
As a developer point of view, the job is done :) Now, it is time for the OPS/SRE to configure Grafana to link Loki and Tempo through the TraceID field.
For that, you can create a derived field directly in the datasource configuration:
datasources:
  - name: Loki
    type: loki
    access: proxy
    uid: loki
    url: http://loki:3100
    jsonData:
        maxLines: 1000
        derivedFields:
          - datasourceUid: tempo
            matcherRegex: '\"TraceID\": \"(\w+).*\"'
            name: TraceID
            # url will be interpreted as query for the datasource
            url: '$${__value.raw}'
            # optional for URL Label to set a custom display label for the link.
            urlDisplayLabel: 'View Trace'

  - name: Tempo
    type: tempo
    access: proxy
    uid: tempo
    url: http://tempo:3200
    jsonData:
      nodeGraph:
        enabled: true
      serviceMap:
        datasourceUid: 'mimir'
      tracesToLogs:
        datasourceUid: loki
        filterByTraceID: true
        filterBySpanID: false
        mapTagNamesEnabled: false
Now you will be able to browse directly to the corresponding trace from your log event and the other way around.
9 Metrics
Now, let us deep dive into the metrics of our application! We can do that through Prometheus.
We can configure now Prometheus to grab the metrics exposed by our application.
To do that, we need first to activate the Prometheus endpoint:
We need to add this dependency first:
implementation 'io.micrometer:micrometer-registry-prometheus'And enable the corresponding endpoint:
management.endpoints.web.exposure.include=health,info,prometheusAfter enabling it, as a developer point of view, it is done :-)
The prometheus statistics can be scrapped by Prometheus itself using this configuration
scrape_configs:
- job_name: prometheus
  honor_timestamps: true
  scrape_interval: 15s
  scrape_timeout: 10s
  metrics_path: /actuator/prometheus
  scheme: http
  static_configs:
    - targets:
        - host.docker.internal:8080
Finally, you can directly browse it through Grafana to integrate all of these metrics into your dashboards 🎉.
10 Conclusion
I endeavored to provide you with a comprehensive overview of what an OPS professional could anticipate while investigating an issue and the corresponding topics that require attention.
As you probably figured out, we only applied just a bunch of configuration sets.
One of the key merits of these tools lies in their non-intrusiveness within the code itself.
To cut long story short: it is not a big deal!
Integrating these configurations can be a significant stride forward, providing invaluable assistance to the entire IT team, from development to operations, as they navigate and troubleshoot issues—whether in production or elsewhere.
I will finish this article by my opinion on such topics: regardless of the targeted tools, this set of configuration must be considered as the first feature to implement for every cloud native application.