Enhancing Asynchronous Transaction Monitoring: Implementing Distributed Tracing in Apache Camel Applications with OpenTelemetry

1 Introduction
In today’s dynamic landscape, Distributed Tracing has emerged as an indispensable practice. It helps to understand what is under the hood of distributed transactions, providing answers to pivotal questions: What comprises these diverse requests? What contextual information accompanies them? How extensive is their duration?
Since the introduction of Google’s Dapper, a plethora of tracing solutions has flooded the scene. Among them, OpenTelemetry has risen as the frontrunner. Other alternatives such as Elastic APM and DynaTrace are also available.
This toolkit seamlessly aligns with APIs and synchronous transactions, catering to a broad spectrum of scenarios.
However, what about asynchronous transactions? The necessity for clarity becomes even more pronounced in such cases. Particularly in architectures built upon messaging or event streaming brokers, attaining a holistic view of the entire transaction becomes arduous.
Why does this challenge arise? It’s a consequence of functional transactions fragmenting into two loosely coupled subprocesses:

Hopefully you can rope OpenTelemetry in it to shed light.
I will explain in this article how to set up and plug OpenTelementry to gather asynchronous transaction traces using Apache Camel and Artemis. The first part will use Jaeger and the second one, Tempo and Grafana to be more production ready.
All the code snippets are part of this project on GitHub. (Normally) you can use and run it locally on your desktop.
2 Jaeger
2.1 Architecture
The SPANs are broadcast and gathered through OpenTelemetry Collector. It finally sends them to Jaeger.
Here is the architecture of such a platform:

2.2 OpenTelemetry Collector
The cornerstone of this architecture is the collector. It can be compared to Elastic LogStash or an ETL. It will help us get, transform and export telemetry data.

For our use case, the configuration is quite simple.
First, here is the Docker Compose configuration:
  otel-collector:
    image: otel/opentelemetry-collector:0.75.0
    container_name: otel-collector
    command: [ "--config=/etc/otel-collector-config.yaml" ]
    volumes:
      - ./docker/otel-collector-config.yaml:/etc/otel-collector-config.yaml
    ports:
      - "1888:1888"   # pprof extension
      - "8888:8888"   # Prometheus metrics exposed by the collector
      - "8889:8889"   # Prometheus exporter metrics
      - "13133:13133" # health_check extension
      - "4317:4317"   # OTLP gRPC receiver
      - "55670:55679" # zpages extension
and the otel-collector-config.yaml:
# (1)
receivers:
  otlp:
    protocols:
      grpc:
        endpoint: "0.0.0.0:4317"
      http:
        endpoint: "0.0.0.0:4318"

  prometheus:
    config:
      scrape_configs:
        - job_name: 'test'
          metrics_path: '/actuator/prometheus'
          scrape_interval: 5s
          static_configs:
            - targets: ['host.docker.internal:8080']
# (2)
exporters:
  #  prometheus:
  #    endpoint: "0.0.0.0:8889"
  #    const_labels:
  #      label1: value1

  logging:

  jaeger:
    endpoint: jaeger:14250
    tls:
      insecure: true
#  zipkin:
#    endpoint: http://zipkin:9411/api/v2/spans
#    tls:
#      insecure: true

# (3)
processors:
  batch:

extensions:
  health_check:
  pprof:
    endpoint: :1888
  zpages:
    endpoint: :55679
# (4)
service:
  extensions: [pprof, zpages, health_check]
  pipelines:
    traces:
      receivers: [otlp]
      processors: [batch]
      exporters: [logging, jaeger]
    metrics:
      receivers: [otlp]
      processors: [batch]
      exporters: [logging]
Short explanation
If you want further information about this configuration, you can browse the documentation.
For those who are impatient, here are a short explanation of this configuration file:
- Where to pull data?
- Where to store data?
- What to do with it?
- What are the workloads to activate?
2.3 What about the code?
The configuration to apply is pretty simple and straightforward. To cut long story short, you need to include libraries, add some configuration lines and run your application with an agent which will be responsible for broadcasting the SPANs.
2.3.1 Libraries to add
For an Apache Camel based Java application, you need to add this starter first:
<dependency>
   <groupId>org.apache.camel.springboot</groupId>
   <artifactId>camel-opentelemetry-starter</artifactId>
</dependency>
In case you set up a basic Spring Boot application, you only have to configure the agent (see below).
2.3.2 What about the code?
This step is not mandatory. However, if you are eager to get more details in your Jaeger dashboard, it is advised.
In the application class, you only have to put the @CamelOpenTelemetry annotation.
@CamelOpenTelemetry
@SpringBootApplication
public class DemoApplication {
[...]
If you want more details, you can check the official documentation.
2.3.3 The Java Agent
The java agent is responsible for instrumenting Java 8+ code, capturing metrics and forwarding them to the collector.
In case you don’t know what is a Java Agent, I recommend watching this conference.
Its documentation is available on GitHub. The detailed list of configuration parameters is available here. You can configure it through environment, system variables or a configuration file.
For instance, by default, the OpenTelemetry Collector default endpoint value is http://localhost:4317.
You can alter it by setting the OTEL_EXPORTER_OTLP_METRICS_ENDPOINT environment variable or the otel.exporter.otlp.metrics.endpoint java system variable (e.g., using -Dotel.exporter.otlp.metrics.endpoint option ).
In my example, we use Maven configuration to download the agent JAR file and run our application with it as an agent.
Example of configuration
<profile>
    <id>opentelemetry</id>
    <activation>
        <property>
            <name>apm</name>
            <value>otel</value>
        </property>
    </activation>
    <build>
        <plugins>
            <plugin>
                <groupId>org.apache.maven.plugins</groupId>
                <artifactId>maven-dependency-plugin</artifactId>
                <executions>
                    <execution>
                        <id>copy-javaagent</id>
                        <phase>process-resources</phase>
                        <goals>
                            <goal>copy</goal>
                        </goals>
                        <configuration>
                            <artifactItems>
                                <artifactItem>
                                    <groupId>io.opentelemetry.javaagent</groupId>
                                    <artifactId>opentelemetry-javaagent</artifactId>
                                    <version>${opentelemetry-agent.version}</version>
                                    <overWrite>true</overWrite>
                                    <outputDirectory>${project.build.directory}/javaagents</outputDirectory>
                                    <destFileName>javaagent.jar</destFileName>
                                </artifactItem>
                            </artifactItems>
                        </configuration>
                    </execution>
                </executions>
            </plugin>
            <plugin>
                <groupId>org.springframework.boot</groupId>
                <artifactId>spring-boot-maven-plugin</artifactId>
                <configuration>
                    <agents>
                        <agent>${project.build.directory}/javaagents/javaagent.jar</agent>
                    </agents>
                    <!--                    <systemPropertyVariables>-->
                    <!--                        <otel.traces.sampler>parentbased_traceidratio</otel.traces.sampler>-->
                    <!--                        <otel.traces.sampler.arg>0.2</otel.traces.sampler.arg>-->
                    <!--                    </systemPropertyVariables>-->
                </configuration>
            </plugin>
        </plugins>
    </build>
</profile>
The variables in comment (e.g., otel.traces.sampler) can be turned on if you want to sample your forwarded data based on a head rate limiting.
Before running the whole application (gateway, producer,consumer), you must ramp up the infrastructure with Docker compose. The source is available here.
cd containers
docker compose up
You can now start both the producer and the consumer:
mvn clean spring-boot:run -Popentelemetry -f camel-producer/pom.xmlmvn clean spring-boot:run -Popentelemetry -f camel-consumer/pom.xmlThe gateway can also be turned on and instrumented in the same way. You can run it as:
mvn clean spring-boot:run -Popentelemetry -f gateway/pom.xml2.3.4 How is made the glue between the two applications?
The correlation is simply done using headers. For instance, in the consumer application, when we consume the messages as:
   from("activemq:queue:HELLO.WORLD?disableReplyTo=true")
                .routeId("consume-message")
                .routeDescription("Consumer example")
                .log(LoggingLevel.INFO, "New message with trace=${header.traceparent}")
                .log("----> "+bodyAs(String.class).toString())
                .log("HEADERS ${in.headers}")
                .end();
I logged on purpose the traceparent header.
New message with trace=00-1a4f6943b7ace96d7efae4c4404009d8-cfbdb98266a772d7-01It allows to Jaeger to correlate our two transactions.
For your information, here are all the headers available while consuming the message
{__AMQ_CID=ID:XXXX-0:1,
  accept=*/*,
  accept-encoding=gzip,
  deflate,
  CamelHttpCharacterEncoding=UTF-8,
  CamelHttpMethod=GET,
  CamelHttpPath=,
  CamelHttpUri=/camel/test,
  CamelHttpUrl=http://127.0.0.1:8080/camel/test,
  CamelMessageTimestamp=1693567851901,
  CamelServletContextPath=/test,
  content-length=0,
  forwarded=proto=http;host="localhost:9080";for="127.0.0.1:39352",
  host=127.0.0.1:8080,
  JMSCorrelationID=null,
  JMSCorrelationIDAsBytes=null,
  JMSDeliveryMode=2,
  JMSDestination=queue://HELLO.WORLD,
  JMSExpiration=0,
  JMSMessageID=ID:XXXX-1:1:1:1:75,
  JMSPriority=4,
  JMSRedelivered=false,
  JMSReplyTo=null,
  JMSTimestamp=1693567851901,
  JMSType=null,
  JMSXGroupID=null,
  JMSXUserID=null,
  traceparent=00-dea6abbd4357819b7416236bab19e557-8840b18dd799cfac-01,
  user-agent=HTTPie/1.0.3,
  x-forwarded-for=127.0.0.1,
  x-forwarded-host=localhost:9080,
  x-forwarded-port=9080,
  x-forwarded-proto=http
}
2.4 Dashboard
To get traces, I ran this dumb command to inject traces into Jaeger:
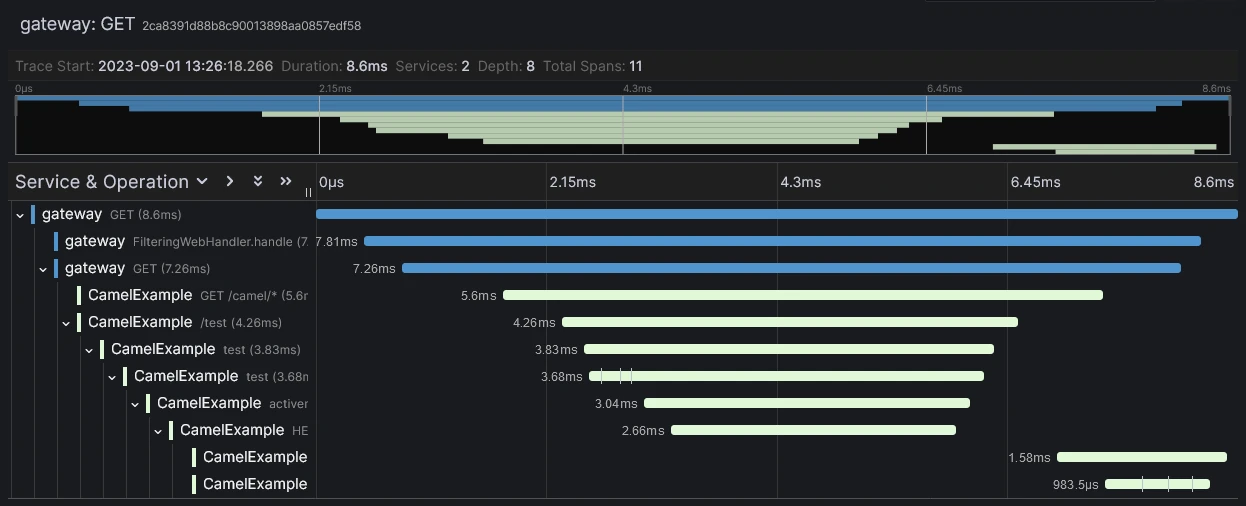
while true ; http :9080/camel/test; endNow, you can browse Jaeger (http://localhost:16686) and query it to find trace insights:
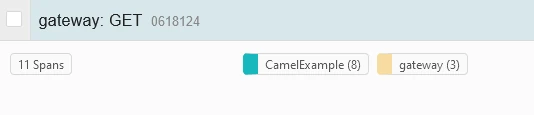
If you dig into one transaction, you will see the whole transaction:
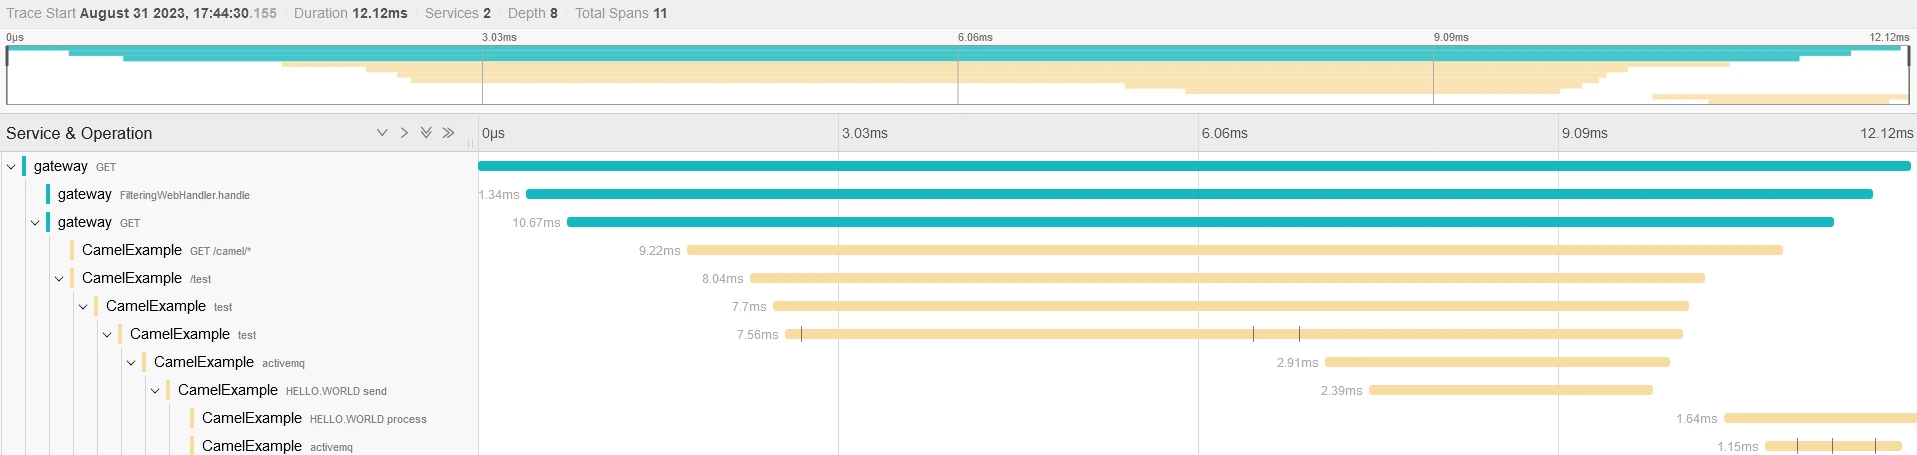
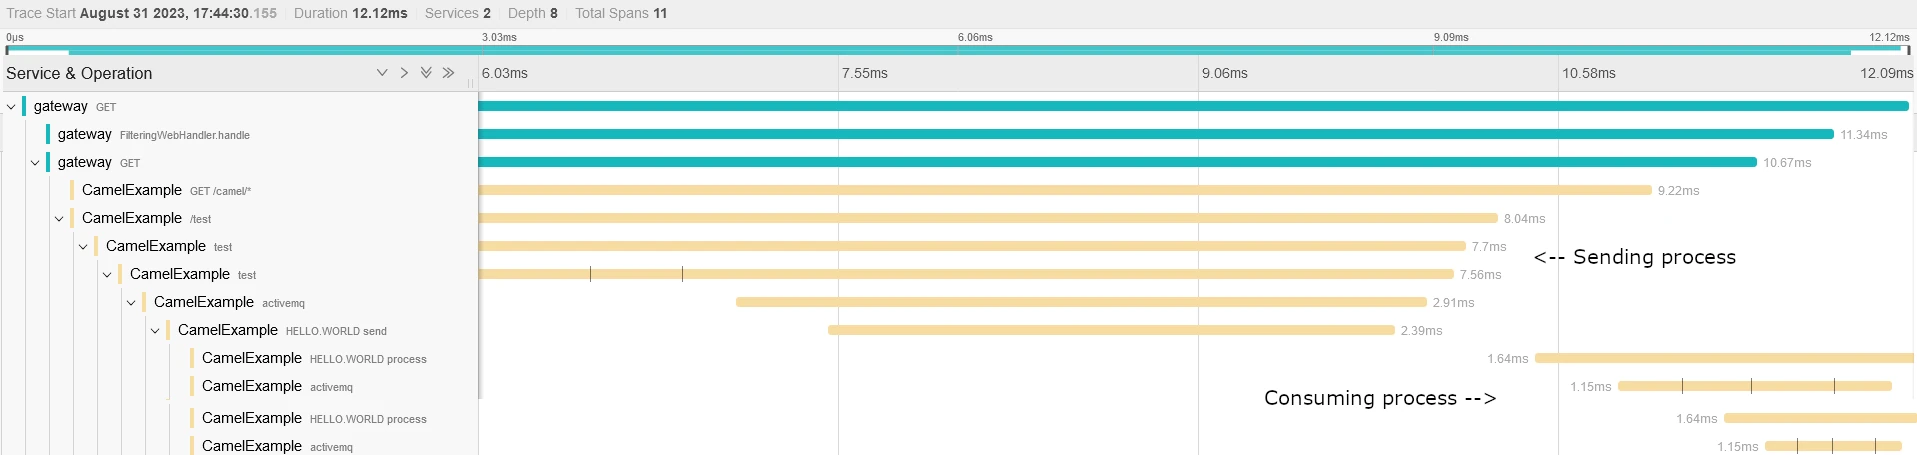
And now, you can correlate two sub transactions:
3 Tempo & Grafana
This solution is pretty similar to the previous one. Instead of pushing all the data to Jaeger, we will use Tempo to store data and Grafana to render them. We don’t need to modify the configuration made in the existing Java applications.
3.1 Architecture
As mentioned above, the architecture is quite the same. Now, we have the collector which broadcast data to Tempo. We will then configure Grafana to query to it to get traces.

3.2 Collector configuration
The modification of the Collector is easy (for this example). We only have to specify the tempo URL.
receivers:
  otlp:
    protocols:
      grpc:
        endpoint: "0.0.0.0:4317"
      http:
        endpoint: "0.0.0.0:4318"

  prometheus:
    config:
      scrape_configs:
        - job_name: 'test'
          metrics_path: '/actuator/prometheus'
          scrape_interval: 5s
          static_configs:
            - targets: ['host.docker.internal:8080']
exporters:
  otlp:
    endpoint: tempo:4317
    tls:
      insecure: true
service:
  pipelines:
    traces:
      receivers: [otlp]
      exporters: [otlp]
3.3 Tempo configuration
I used here the standard configuration provided in the documentation:
server:
  http_listen_port: 3200

distributor:
  receivers:                           # this configuration will listen on all ports and protocols that tempo is capable of.
    jaeger:                            # the receives all come from the OpenTelemetry collector.  more configuration information can
      protocols:                       # be found there: https://github.com/open-telemetry/opentelemetry-collector/tree/main/receiver
        thrift_http:                   #
        grpc:                          # for a production deployment you should only enable the receivers you need!
        thrift_binary:
        thrift_compact:
    zipkin:
    otlp:
      protocols:
        http:
        grpc:
    opencensus:

ingester:
  max_block_duration: 5m               # cut the headblock when this much time passes. this is being set for demo purposes and should probably be left alone normally

compactor:
  compaction:
    block_retention: 1h                # overall Tempo trace retention. set for demo purposes

metrics_generator:
  registry:
    external_labels:
      source: tempo
      cluster: docker-compose
  storage:
    path: /tmp/tempo/generator/wal
    remote_write:
      - url: http://prometheus:9090/api/v1/write
        send_exemplars: true

storage:
  trace:
    backend: local                     # backend configuration to use
    wal:
      path: /tmp/tempo/wal             # where to store the wal locally
    local:
      path: /tmp/tempo/blocks

overrides:
  metrics_generator_processors: [service-graphs, span-metrics] # enables metrics generator

search_enabled: true
3.4 Grafana configuration
Now we must configure Grafana to enable querying into our tempo instance. The configuration is made here using a configuration file provided during the startup
The datasource file:
apiVersion: 1
datasources:
  # Prometheus backend where metrics are sent
  - name: Prometheus
    type: prometheus
    uid: prometheus
    url: http://prometheus:9090
    jsonData:
      httpMethod: GET
    version: 1
  - name: Tempo
    type: tempo
    uid: tempo
    url: http://tempo:3200
    jsonData:
      httpMethod: GET
      serviceMap:
        datasourceUid: 'prometheus'
    version: 1
3.5 Dashboard
As we have done before, we must start the infrastructure using Docker Compose:
cd containers
docker compose -f docker-compose-grafana.yml up
Then, using the same rocket scientist maven commands, we can run the same commands and browse now Grafana (http://localhost:3000) to see our traces:
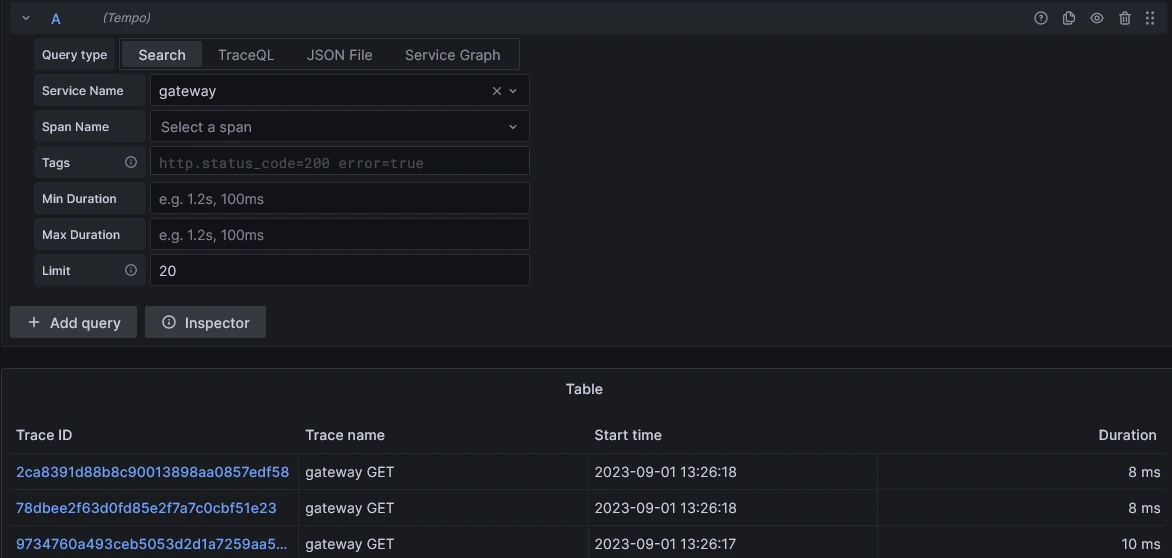
4 Conclusion
We saw how to highlight asynchronous transactions and correlate them through OpenTelemetry and Jaeger or using Tempo & Grafana. It was voluntarily simple.
If you want to dig into OpenTelemetry Collector configuration, you can read this article from Antik ANAND (Thanks to Nicolas FRANKËL for sharing it) and the official documentation. A noteworthy aspect of OpenTelemetry lies in its evolution into an industry-standard over time. For instance,Elastic APM is compatible with it.
I then exposed how to enable this feature on Apache Camel applications. It can be easily reproduced with several stacks.
Last but not least, which solution is the best?
I have not made any benchmark of Distributed Tracing solutions. However, for a real life production setup, I would dive into Grafana and Tempo and check their features. I am particularly interested in mixing logs, traces to orchestrate efficient alerting mechanisms.